
Which Hamilton postal codes are COVID-19 hotspots
Published November 20, 2020 at 8:55 am
A patch of the south-central downtown core has had the most positive cases per capita among those tested for COVID-19 in Hamilton.
The data is provided by ICES, a not-for-profit research institute and updated for the week of Nov. 8 to 14.
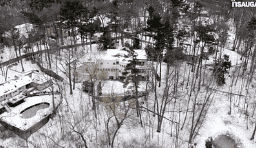
The L8N area code, which mostly makes up the Corktown and Stinson neighbourhoods had an 8 per cent positive test rate. The gap between L8N and L9K, which had the second-highest rate, was significant. L9K, which mostly represents the Meadowlands area in Ancaster, came in at 4.7 per cent.

Map of the L8N area code in Hamilton. (Google Maps)
Overall, Hamilton had a 2.19 per cent positive rate from Nov. 8 to 14—the week it was announced by Ontario Premier Doug Ford that the city would be moved to the Red ‘Control’ category with added restrictions.
Many in Hamilton slammed the Province’s decision as residents try to decipher the methodology being used by Premier Ford. Windsor-Essex County, for example, had a 3.09 per cent positive rate during the same period. Yet, they’ve been placed in the Yellow ‘Protect’ zone, which is two categories higher than Hamilton in terms of leniency when it comes to COVID-19 restrictions.
Related: Mixed messaging and unfair targeting: Hamilton bars and restaurants are frustrated with the Province
Videos


Since the start of the pandemic, Windsor-Essex has had more cases and more deaths than Hamilton despite having nearly a third of the population.
Meanwhile, the Halton Region was at 4.7 per cent, Toronto and York reached 6 per cent, and Peel had a 12 per cent positive rate. All four are with Hamilton in Red.
The latest data from ICES shows Ontario as a whole had a 4.2 per cent positive COVID-19 rate among those tested.
insauga's Editorial Standards and Policies advertising